Advanced SaaS Metrics – Accounting for Upsell
This is a guest post by Phil Edmondson-Jones, Principal at Oxx. Oxx is [...]
This is a guest post by Phil Edmondson-Jones, Principal at Oxx. Oxx is a specialist SaaS investor, backing Europe’s most promising B2B SaaS scale-ups from Series A and beyond. Want more insights from the Oxx team? Phil’s colleague Mikael Johnsson joined The SaaS Revolution Show in September 2020.
B2B SaaS companies have gotten the memo – CAC, CAC payback and LTV/CAC are key to running your business. Not only are they important to track and report to investors for your next fundraising round, but more importantly, they should be key evidence for your sales and marketing investment decisions. Particularly in these uncertain times, having a strong grasp on your go to market risk and return metrics is now more important than ever before.
As a specialist investor in B2B SaaS companies, we have seen that the simple off-the-shelf formulae typically used to calculate these metrics aren’t always fit for purpose for SaaS operators seeking to make optimal sales and marketing spend decisions. They’re great for us VCs to quickly analyse and benchmark your business in a simple way, but not always a sufficient basis to make sound business decisions.
This is because the way these metrics are commonly calculated can be skewed, and they’re not specific enough to be informative on where money should be spent in your commercial team.
In this article, we shine a light on how a common characteristic of top enterprise SaaS companies, strong and persistent upsell, can confuse accurate calculation of these simple but crucial metrics. We’ll also walk you through a practical method we sometimes use to correct this bias, and also allow you to illustrate rates of return from both your new business team and your customer success team.
By the end, if we’ve done our job properly, you should be able to not only make more robust decisions on how much to invest in sales and marketing, but also where specifically you should invest.
Shortcomings of The Status Quo
At its simplest, CAC payback period is defined by relating the gross margin generated in a period to the relevant cost of acquiring that gross margin1. It is a risk metric that illustrates the time taken to recoup an upfront investment in sales and marketing. LTV:CAC ratios are the corresponding return metrics, comparing the total value received with the relevant cost.
The basic formulae are quite blunt, for 2 reasons:
- They don’t factor in churn, gross or net, by implicitly assuming a net revenue retention rate of 100%. This omission is often corrected for in B2C subscription businesses with high gross churn, but rarely included for enterprise SaaS businesses with significant upsell.
- They conflate the costs & returns of two distinct activities (new business and upsell generation) happening on different groups (cohorts) of customers during the same calculation period. As such, the result shows a cross-sectional snapshot at a point in time, rather than necessarily being an accurate predictor of future outcomes.
If you work at an enterprise SaaS business with a distinct upsell generation team of customer success (“CS”) professionals and high net revenue retention (“NRR”) of 130%+, you may have encountered a bit of a calculation paradox when producing these risk and return metrics: not including any upsell might lead to very low lifetime values and long payback periods, but including upsell results in the opposite.
Let’s take a stylized numerical example to illustrate this. Consider a $3m ARR business growing 100% annually, with average annual contract values (“ACV”) of $100k, gross margins (“GM”) of 75%, and net revenue retention (“NRR”) of 130%. Total sales and marketing costs from the prior quarter are an annualised $4.5m, of which, $3m is from new business activities, and $1.5m from upsell activities. The business acquired an annual run-rate of 30 new clients in the current quarter, so overall CAC is $150k.
Simple Calculation
The simple calculations literally compare sales and marketing investment in one period to the gross margin generated as a result of this investment on a straight-line basis (often one quarter later to account for the length of sales cycles). So they compare investment in new business generation and upsell teams collectively, in both winning new clients, and upselling the stock of all existing clients that are due for contract renewals.
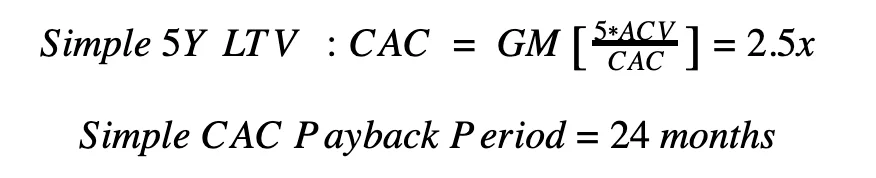
N.B. we have used 5-year periods simply for presentation purposes – it implicitly assumes 20% gross churn, which is high for a SaaS business.
As an entrepreneur, you might feel that this doesn’t quite capture fair value for your upsell-focussed team’s hard work and so under-estimates ROIs and over-estimates payback periods. After all, if you just included the acquisition cost for newly won clients (excluding the cost of your upsell team), your CAC would be $100k, and your ROI would jump up to 3.8x. This is potentially a very fair point!
Compound Calculation
Thinking about your clients in cohorts (groups of clients newly acquired in a set time period, typically a calendar quarter) is the starting point to improving accuracy of measurement. Looking on a cohort basis compares upfront sales and marketing investment in both commercial teams to a more refined estimate of the lifetime value that is earnt from this investment, incorporating increases (upsell) and decreases (churn) over time.
To adjust for this, we often see SaaS businesses propose a calculation like the following:
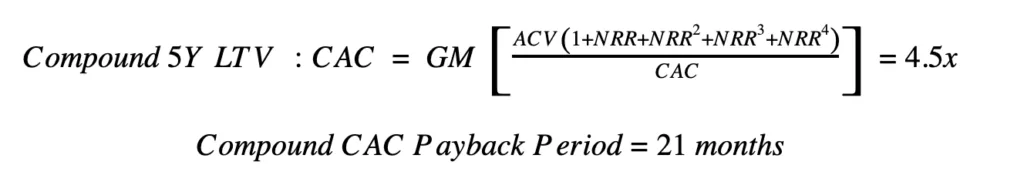
That Looks Great!
It does, but it’s probably too good to be true, unfortunately. There’s a few reasons why we think this probably over-corrects – over-estimating ROI to a very heady level and reducing payback by a whole quarter:
- Firstly, achieving persistently compounding NRRs of 130%+ is a highly challenging feat achieved by only the top SaaS businesses in the public or private sectors2.
- Secondly, even if the numbers are operationally achievable, the CAC figures are based on the cost of the new business & upsell teams in one period. It’s then including one period of new business revenue, but 4 periods of future upsell revenue, based on the cost of the entire upsell team in one period.
- That’s highly unlikely to be a fair apportionment of cost incurred vs work needed to generate future revenue, based on the relationship between the company’s customer growth rate and future CS costs.
- Said another way, it’s very likely the costs associated with generating 4 periods of upsell revenue will be greater than the full cost of the upsell team in the previous period.
Point number (2) above is nuanced, so consider the below examples to illustrate:
- Your business is doubling ARR every year, and you’re not generating CS operational efficiencies, so CS costs are also doubling. Your upfront CS cost will be equal to half the cost of your CS team a year from now. In a year, that team will be upselling the clients acquired in the current period and all previously acquired clients that are renewing, which will represent half the total number of clients you’re able to upsell if your business has been roughly doubling each year. Therefore the full initial CS cost used in the calculation equals half of the actual CS cost a year from now, which is exactly the proportion of newly acquired customers to upsell vs the total ‘upsellable’ client base. So only including 1 year of upsell would be totally appropriate! Include any more upsell, you need to include future CS costs.
- Alternatively, consider when your business is later stage, growing ARR 50% annually and has spare capacity in the CS team, so can scale revenue without increasing CS costs. The lagged CS team would be working on 67% of the following year’s upsellable client base, 44% of the following year etc. So ~2 years of upsell would be legitimate based on the original CS cost base in this case.
At Oxx, our perspective as investors and advisors is to be conservative and treat longer term upsell forecasts prudently. Including any upsell over one or two years forward is generally not advised, with the exception of later stage businesses with operational evidence of achieving this, and only providing they include an appropriately scaled CS cost in the denominator.
Our Solution? A Balanced Calculation
Practically speaking – after a projected year or two of positive NRR in the calculation, our view is it’s appropriate to then apply the business’ gross retention rate (“R”, or 1 – gross churn) for the remaining years to generate a LTV, and then compare against scaled CAC (SF denoting ‘scale factor’) to calculate payback period.
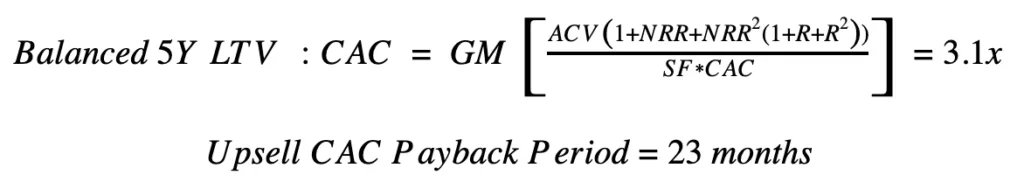
Quick note – you can see here why the simple payback formula can work remarkably well, particularly in cases of both low upsell, and low gross churn – the upfront years of positive net revenue retention and later years of gross churn are approximately equal, and so net each other out.
In the calculation above, CAC has to be scaled up because 2 years of NRR are included in the numerator, so an appropriate cost uplift needs to be incorporated for the work in upselling those clients. This can be calibrated by looking at growth in client numbers and forecast growth in CS costs to ensure CS cost is appropriately scaled up to match with 2 years’ worth of upsell revenue. In this example, some efficiencies in the future CS team meant upsell revenue growth exceeded team growth, and the SF used was 110%.
There are several important differences to note between the calculations:
- Firstly, note the ROI figures are extremely sensitive to upsell assumptions – the 4.5x in the Compound example is (in our view) really punchy.
- Secondly, whilst the difference in payback period between the Simple and Balanced versions is nominally just 1 month, if the company bills all contracts annually up front, the difference between the Simple payback calculation and both of the others is actually 1 year!
- This makes a huge difference to your working capital tied up in client acquisition. If some of your clients pay upfront on longer contract durations than one year, you should also make sure to incorporate cash in contextualising your payback periods.
- Thirdly, they surface a helpful reminder that your CS costs associated with pure retention should be incorporated within your GM calculations, whilst the commercial upselling part of their job resides in your overhead and CAC calculations.
- Lastly, note the importance of the scaling factor – which is determined by your client growth rate and efficiency of your CS team. Improving operating efficiencies in your CS team can really pay dividends in reducing real payback periods and improving your capital efficiency.
Why is this all important? Companies which over-estimate lifetime values, and therefore under-estimate true payback periods, can end up burning through significantly more cash to hit their revenue projections, or preserving cash burn and consistently missing targets. Conversely – some businesses using the standard formula where they do demonstrate strong upsell and low churn might under-invest in sales and marketing and not fulfill the company’s growth potential.
Knowing these numbers will allow you to right-size your total sales and marketing spend for your businesses’ needs, improving both business performance and forecasting accuracy.
Celebrating Upsell
Breaking this down further, it’s possible (but admittedly a bit fiddly) to analyse your risk and return metrics for new business and upsell activities separately, which is the ultimate benefit of conducting this advanced analysis. The basic premise is to split costs and margins of the separate activities over time. The trick to doing this is applying “R” (gross revenue retention) to the new business revenue after the first year, and the net balance from the total lifetime value for each year is the corresponding income from your upsell team.
In our stylized example, assuming R of 90% and splitting margins from new business and from upsell teams generates a 2.8x LTV:CAC for new business, and an impressive 3.8x for the upsell team. Theory would prescribe increasing marginal spend on upsell rather than new business activities until the ROIs on each investment activity are near equal to maximise your outcomes.
In the real world, we have seen multiple high quality B2B SaaS businesses that are achieving a significant proportion of their overall new ARR from upsell, whilst the cost of the upsell team is still a very small proportion of the total sales and marketing cost. Consequently, on a blended basis, upsell payback periods are subsidising longer payback periods for new client acquisition. This can be quite typical of a successful land and expand strategy, but this level of analysis is rarely conducted in early-growth stage businesses. We feel it can provide robust evidence to inform how much to accelerate sales and marketing spend overall, and whether you should prioritise hiring more CS professionals, rather than new business development or account executive professionals.
In the example above – if your sales and marketing team was more weighted towards new business rather than upsell (say $0.5m in cost moves out of CS and into new business), the ROI for the upsell team becomes a huge 5.7x, compared to a more meagre 2.4x for the new business team. Boosting the size of your CS team might be a very profitable decision!
Concluding Thoughts
The above is very detailed. It’s important to say that a lot of the time, just calculating the SaaS Magic Number and simple LTV:CAC / CAC payback metrics is sufficient for most purposes. And clearly if your goal is benchmarking against other public or private companies, you need to use the simple versions to ensure apples compare against apples.
Furthermore, we should issue a word of caution around appropriate sample sizes. Relevancy increases exponentially with sample sizes, and at the earlier stages, there simply isn’t enough evidence to draw reliable conclusions. Particularly when you’re iterating product/pricing/distribution at a rapid pace when seeking product market fit, these metrics are prone to varying wildly.
However, if there’s an appropriate bank of evidence to rely on, your CS team and the upsell they generate is an important characteristic of your SaaS business, and you’re looking to validate budgeting decisions or improve forecasting – we recommend going beyond the obvious and analysing metrics on a cohort basis. It may also be worth considering phased cost / return on investment in both new business & upsell teams, as well as incorporating cash payback periods where relevant. Small differences in these numbers can have huge commercial implications!
If you want to talk SaaS metrics generally or have any comments on this article, do reach out to me here or another member of the Oxx team, we’d be delighted to hear from you!
—
Notes
- It’s important it’s gross margin based, rather than revenue based, which is one of the most common mistakes we see when it’s being calculated. If you’re using revenue numbers – the metric you should be looking at is the ‘Magic Number’.
- As context, 130% represents the top decile public SaaS company NRR rate in Q1 2020 (per Redpoint’s analysis here, and we see similar benchmarks in the private companies we look at.